Unlocking Otel in WebAssembly - Wasm I/O 2025
 Ronan Flynn-Curran
otel
spin
wasm

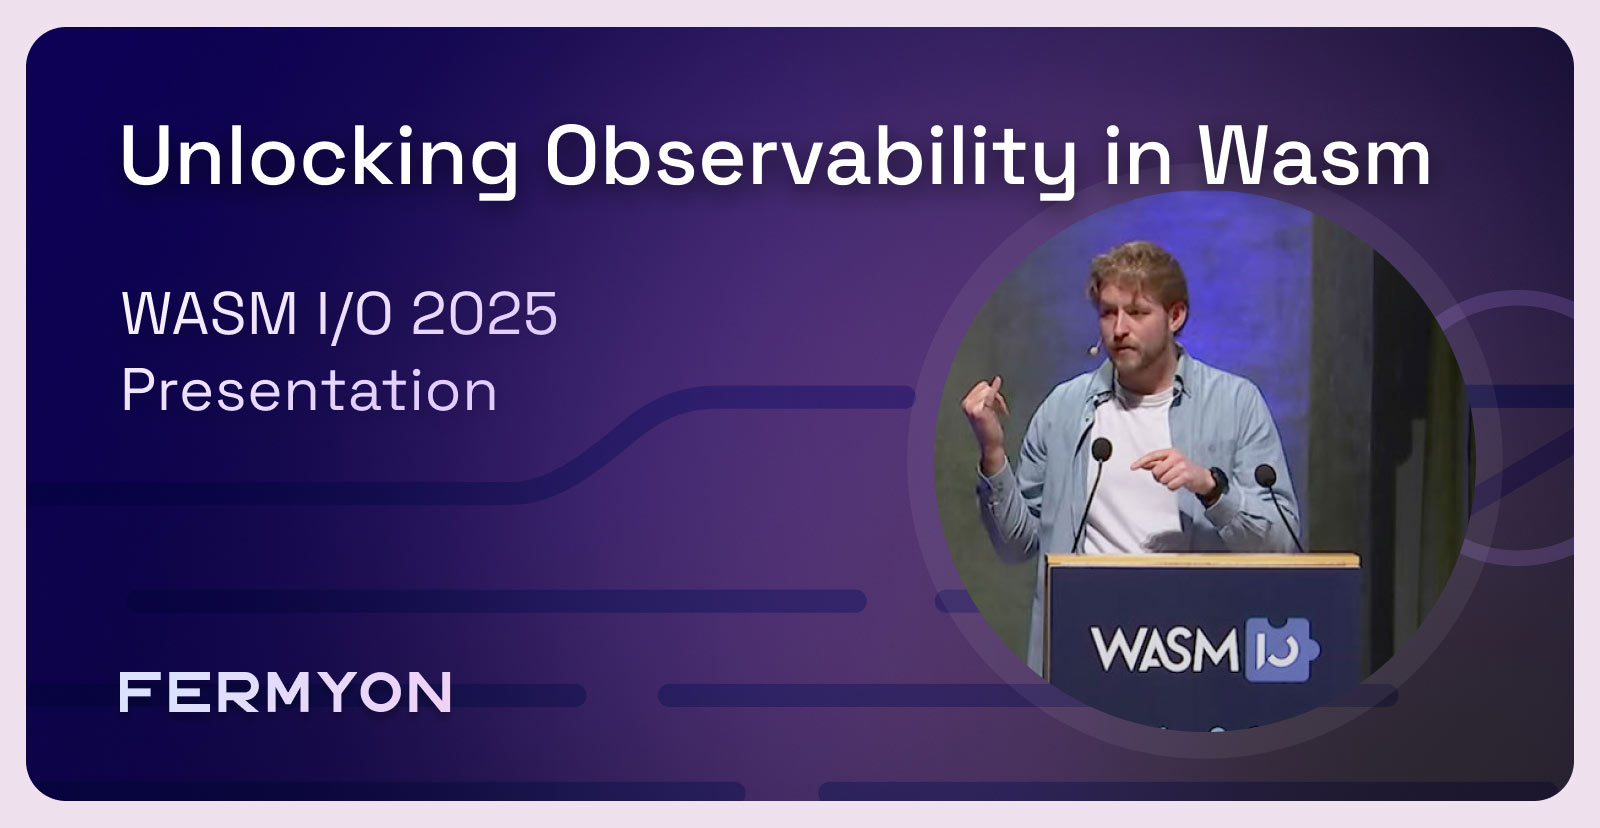
As WebAssembly continues its march into production environments, the need for robust observability becomes increasingly critical. At Wasm I/O 2025, Caleb gave an insightful talk on how OpenTelemetry is solving the observability puzzle for WebAssembly apps.
YouTube Recording: Unlocking Observability in WebAssembly with OpenTelemetry by Caleb Schoepp @ Wasm I/O 2025
The Challenge: Observing the Unobservable
WebAssembly’s sandboxed nature, whilst providing excellent security and portability, creates unique challenges for observability. Traditional monitoring approaches often fall short when dealing with the host-guest architecture that defines WebAssembly apps.
Caleb outlines three key places where telemetry can be collected in WebAssembly systems:
- Host-Guest Telemetry - Observing interactions between the WebAssembly runtime and components
- Inter-Guest Telemetry - Tracking communication between different WebAssembly components
- Intra-Guest Telemetry - Emitting traces from within WebAssembly components themselves
Auto-Instrumentation: The Low-Hanging Fruit
One of WebAssembly’s superpowers is the ability to provide automatic instrumentation without much developer effort. Caleb shows this using Spin, the serverless WebAssembly framework for developing apps. He shows how a simple Rust component automatically generates rich tracing data.
Trace data includes:
- HTTP request handling
- Component execution spans
- Host resource interactions (like key-value store operations)
This auto-instrumentation is cross-language and requires zero code changes - you simply get observability “for free” by running your components in an instrumented runtime.
Beyond Auto-Instrumentation: Custom Tracing
While auto-instrumentation provides valuable baseline visibility, production apps need custom tracing that reflects business logic and application-specific workflows. This is where OpenTelemetry’s standard APIs shine.
The challenge? Getting OpenTelemetry to work seamlessly within WebAssembly’s constrained environment.
Caleb demonstrates two approaches:
Approach 1: HTTP Exporter with WASI-HTTP
Using familiar OpenTelemetry SDKs with an HTTP exporter backed by WASI-HTTP. This approach feels familiar to developers but has limitations:
- Difficult to compile OpenTelemetry libraries to WebAssembly
- Can’t access parent trace context in non-HTTP components
- Unable to properly associate host operations with guest spans
Approach 2: WASI-OTel Processor
A more sophisticated approach using a special processor backed by the new WASI-OTel proposal. This enables:
- Proper parent-child relationships between host and guest spans
- Full trace context propagation across the host-guest boundary
- Seamless integration of host operations into guest-initiated traces
The WASI-OTel Proposal: Bridging the Gap
The WASI-OTel proposal represents a significant step forward for WebAssembly observability. Currently in Phase 0 of the WASI process, it provides:
- Standardized interfaces for telemetry data exchange between host and guest
- Processor callbacks (onStart, onEnd) that notify the host of guest span lifecycle events
- Context propagation methods that enable proper trace parenting
The proposal is wrapped in language-specific SDKs (starting with Rust) that make it transparent for developers to use standard OpenTelemetry APIs while benefiting from WebAssembly-specific optimizations.
Looking Ahead
This work represents the evolution from earlier efforts like WASI-Observe to a more focused, OpenTelemetry-native approach. The community’s convergence around OpenTelemetry as the observability standard drove this decision, ensuring WebAssembly applications can integrate seamlessly with existing observability infrastructure.
Next steps include:
- Advancing WASI-OTel through the WASI standardization process
- Expanding language support beyond Rust
- Adding metrics and logs support (currently focused on tracing)
- Gaining broader runtime support beyond Spin
Why This Matters
As WebAssembly moves beyond experimental use cases into production-critical applications, observability becomes a prerequisite, not a nice-to-have. The combination of automatic instrumentation and developer-controlled custom tracing provides a compelling observability story that could accelerate WebAssembly adoption in enterprise environments.
The work showcased here demonstrates that WebAssembly doesn’t have to be a black box.
With the right tooling and standards, it can provide even richer observability than traditional deployment models, thanks to the runtime’s deep understanding of component interactions and resource usage.
Links